These are the default scales for the units class. These will usually
be added automatically. To override manually, use scale_{type}_units.
Usage
scale_x_units(..., sec.axis = ggplot2::waiver(), unit = NULL)

scale_y_units(..., sec.axis = ggplot2::waiver(), unit = NULL)

scale_colour_units(..., unit = NULL)

scale_color_units(..., unit = NULL)

scale_fill_units(..., unit = NULL)

scale_alpha_units(..., unit = NULL)

scale_size_units(..., unit = NULL)

scale_size_area_units(..., unit = NULL)

scale_radius_units(..., unit = NULL)

scale_linewidth_units(..., unit = NULL)
Arguments
- ...
arguments passed on to the corresponding continuous scale (see the manual page for each
scale_{type}for details).- sec.axis
sec_axis()is used to specify a secondary axis.- unit
A unit specification to use for the guide. If given, the values will be converted to this unit before plotting. An error will be thrown if the specified unit is incompatible with the unit of the data.
Examples
if (requireNamespace("ggplot2", quietly=TRUE)) {
library(ggplot2)
mtcars$consumption <- set_units(mtcars$mpg, mi / gallon)
mtcars$power <- set_units(mtcars$hp, hp)
# Use units encoded into the data
ggplot(mtcars) +
geom_point(aes(power, consumption))
# Convert units on the fly during plotting
ggplot(mtcars) +
geom_point(aes(power, consumption)) +
scale_x_units(unit = "W") +
scale_y_units(unit = "km/l")
# Resolve units when transforming data
ggplot(mtcars) +
geom_point(aes(power, 1 / consumption))
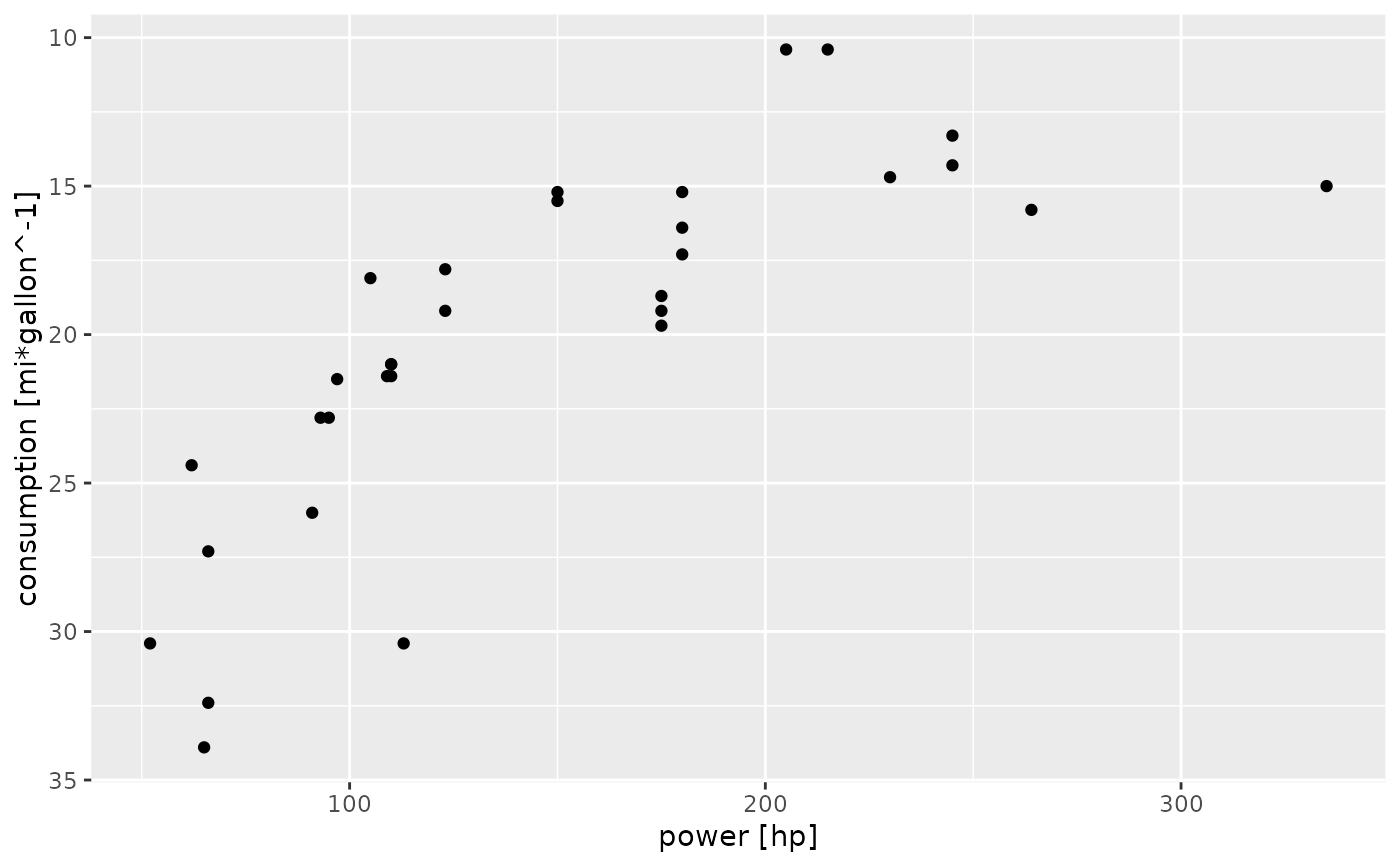
# Reverse the y axis
ggplot(mtcars) +
geom_point(aes(power, consumption)) +
scale_y_units(transform="reverse")
}